Important Notes:
- Diagnostics information is captured only when you have recorded images or videos using Redpen (web app, browser extension, desktop app).
- Network logs are currently captured only for video recordings.
- Console logs, network logs, cookies, IndexedDB, and local storage are available only for the Standard and Teams Premium for Jira plans.
You can see the Diagnostics Information as follows:
Redpen web application
1. Select the captured images and recorded video in the Redpen web application.
2. Click on the Diagnostics button as shown below.

3. Click on the option for the information you want to view.

In the issues created by Redpen in Jira or Azure DevOps
- Capture screenshot/video using Redpen.
- Create an issue using Redpen (Jira or Azure DevOps) with the captured screenshots/video.
- Go to the issue created using Redpen.
You will see the diagnostics info as follows:
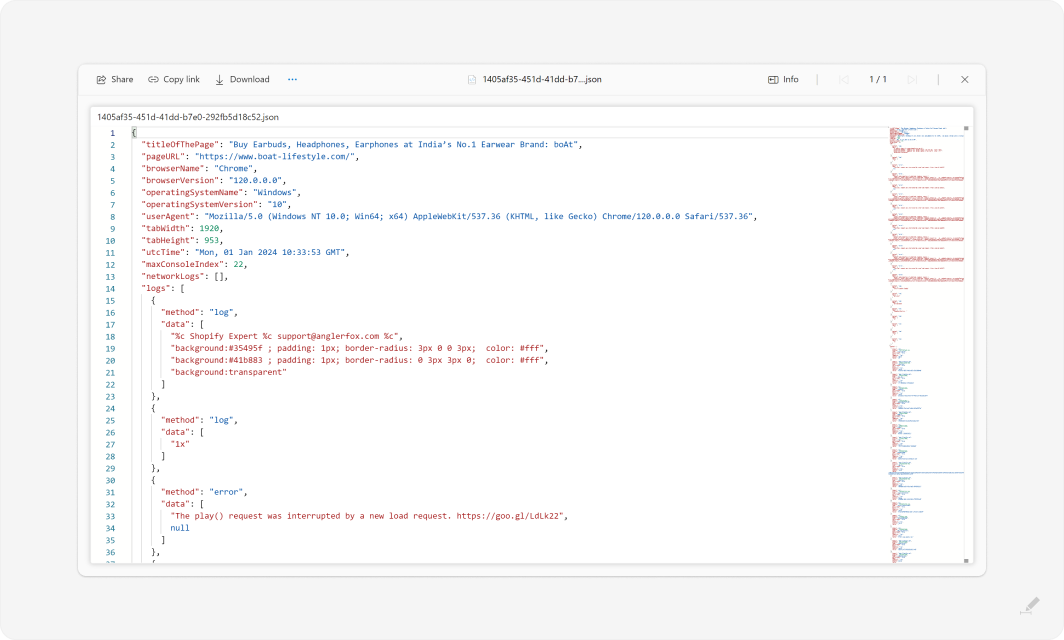
a. JSON file attachment:
A JSON file having the diagnostic information will be attached to the issue created in Jira or Azure DevOps.
Download and open to see diagnostic information.
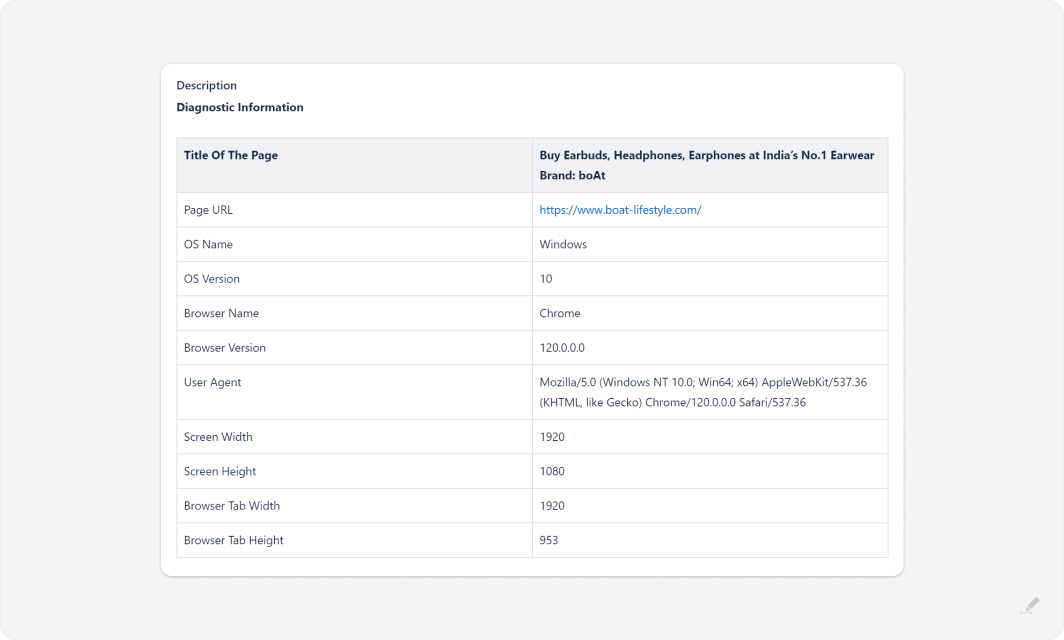
b. Issue description field
If you do not have Jira add-on or Azure DevOps extension installed, the basic diagnostics information will be displayed in the issue description field of the Jira/Azure DevOps issue. The full diagnostics information will be available in the JSON file attached (see 2.a above)
c. Redpen Diagnostics Section
Diagnostic information will be displayed in the Redpen Diagnostics Section in the issue view (Jira or Azure DevOps) if Jira add-on or Azure DevOps extension is installed.
Follow the below steps to see console logs and network logs.
1. Select the image file name from the dropdown for which you want to see the diagnostics information.
2. Basic information will be displayed below it. Click on the Advanced Diagnostic Information.

3. Click on the option for the information you want to view.
